dataplot
ENPT

A company simulator for data engineering

Simulate a company. Build the pipeline on its data.

DataPlot plays the source systems of a business — OLTP databases, event streams, files that land every day — so you can practise ingestion and bronze, silver and gold layers on data that behaves like a real company's.

$ docker run -p 8080:8080 -v dataplot-data:/data gartito/dataplot

Free. No account, and the image sends no telemetry. Open http://localhost:8080.

Sales per day of the simulated supermarket chain: the weekly rhythm, Black Friday and Christmas come from the company's calendar, not from a random curve.

A public dataset is not a company.

Public datasets are static and clean, and nobody runs the source side for you. At work, data arrives live, messy, with history and corrections. DataPlot gives you that side.

Live

Load years of history, then carry on in real time from a cutover date, like a system in production.

With history

Keyed tables get updates and deletes (_op I/U/D), and history changes as in a real company: orders move through statuses, customers update their details and leave.

Messy, if you want

Nulls, duplicates and badly formatted columns on demand. Late and out-of-order events from the app.

Real identifiers

Valid tax and document numbers, EAN-13 barcodes, an SAP-style ERP and each country's own calendar, currency and taxes, in eight countries.

How a lab comes together

You pick the company, its size and where the data goes. The rest — ingestion, modelling, quality, orchestration — is yours, built the way you like.

  1. Pick a companyEach pack is a whole business: a supermarket chain, a music streaming platform.
  2. Size itStart from a preset (small, medium, large) and adjust stores, customers, growth or inflation.
  3. Point it at your servicesDatabases go to your Postgres, events to Kafka, files to a folder or bucket — the way the company's systems would.
  4. Build the pipelineIngest and model bronze, silver and gold. History first, then the stream from the cutover.
THE COMPANYITS SYSTEMS, ON YOUR SERVICESYOUR PIPELINE Stores · customersStock · suppliersOrders · loyalty simulated hour by hour ERP, CRM → Postgres E-commerce events → Kafka Point-of-sale files → storage bronze silver gold you build this part

Companies to practise on

Each company comes with systems that were never meant to talk to each other, with their vendors' names, formats and keys, and a business manual that explains what every column means. Tables, columns and manuals are in English, with the vendors' own names (SAP, VTEX, DDEX); the manual's own text also comes in Portuguese.

batch + stream

Supermarket chain

Hyper, super and express stores, e-commerce, stock with replenishment and stock-outs, weekly promotions, loyalty, in one country or several: each with its prices, taxes, opening hours and retail calendar (Thanksgiving, Diwali, Carnival, Black Friday, Christmas).

Systems

  • Point of sale, NFC-e in Brazil · files
  • SAP-style ERP · Postgres
  • CRM and loyalty · Postgres
  • VTEX-style e-commerce · Kafka

You practise

  • Batch and streaming together
  • Reconciling the stream with the batch
  • CDC of master data and stock
stream

Music streaming

Listening sessions with skips, high-volume, out-of-order app events (offline plays sync later), Friday releases, a long-tail catalogue with each country's own genres, subscriptions in local currencies and monthly royalties per territory.

Systems

  • App events · Kafka
  • Stripe-style subscriptions and billing · Postgres
  • Distributors, DDEX and sales reports · files

You practise

  • High volume and sessions
  • Late events, windows and watermarks
  • Monthly royalty closing
batch + stream

Fast-food franchise

Franchised and company-owned restaurants in one or several countries: counter, drive-thru, kiosk, app and delivery orders, daypart menus and meals, each market's own menu, prices and taxes, and the franchisor's view across every restaurant.

Systems

  • Restaurant POS · Postgres
  • Kiosk, app and drive-thru events · Kafka
  • Delivery aggregators and royalty statements · files
  • Supply, inventory and labour · Postgres

You practise

  • Payouts that arrive days later
  • Monthly royalties against the POS
  • Stock taken by recipes
  • Countries
  • United States
  • United Kingdom
  • Germany
  • France
  • Italy
  • Spain
  • India
  • Brazil

The data goes where you work

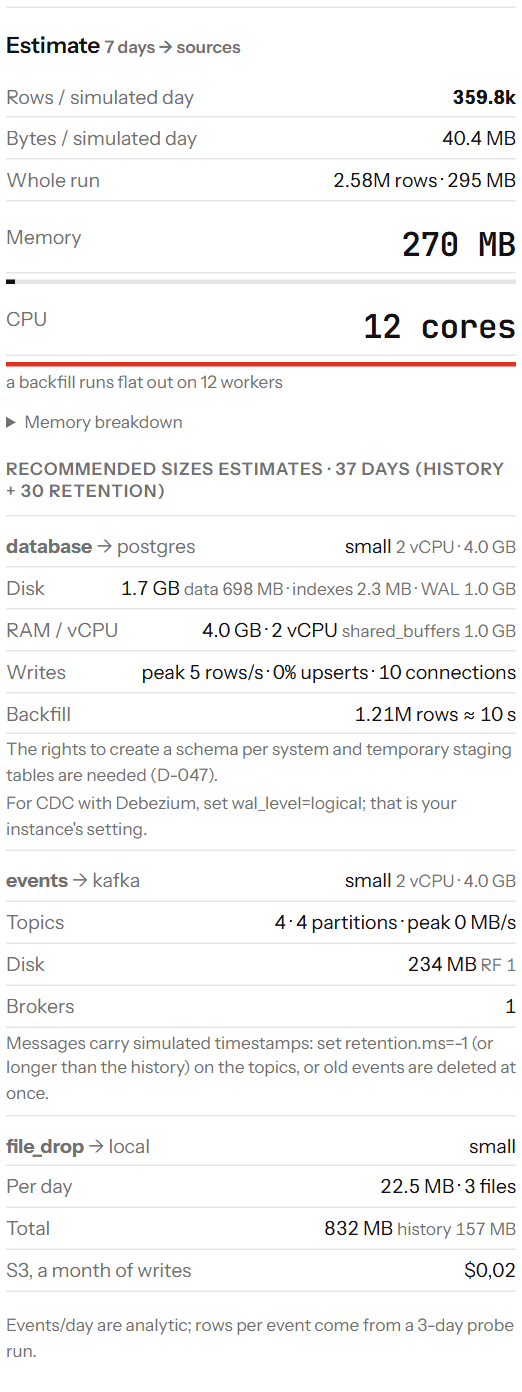
Local or in the cloud: your Postgres, an RDS, a Kafka, an MSK, a folder or an S3 bucket. Before a run, DataPlot estimates rows, bytes, memory and the size of each destination.

Databases

Postgres with upserts per window. Add Debezium if you want to practise change data capture.

Events

Kafka or Redpanda, with keyed messages and tombstones for deletes.

Files

Parquet, CSV, NDJSON, JSON or XML on disk or S3, partitioned by day, with a Glue catalogue to query in Athena.

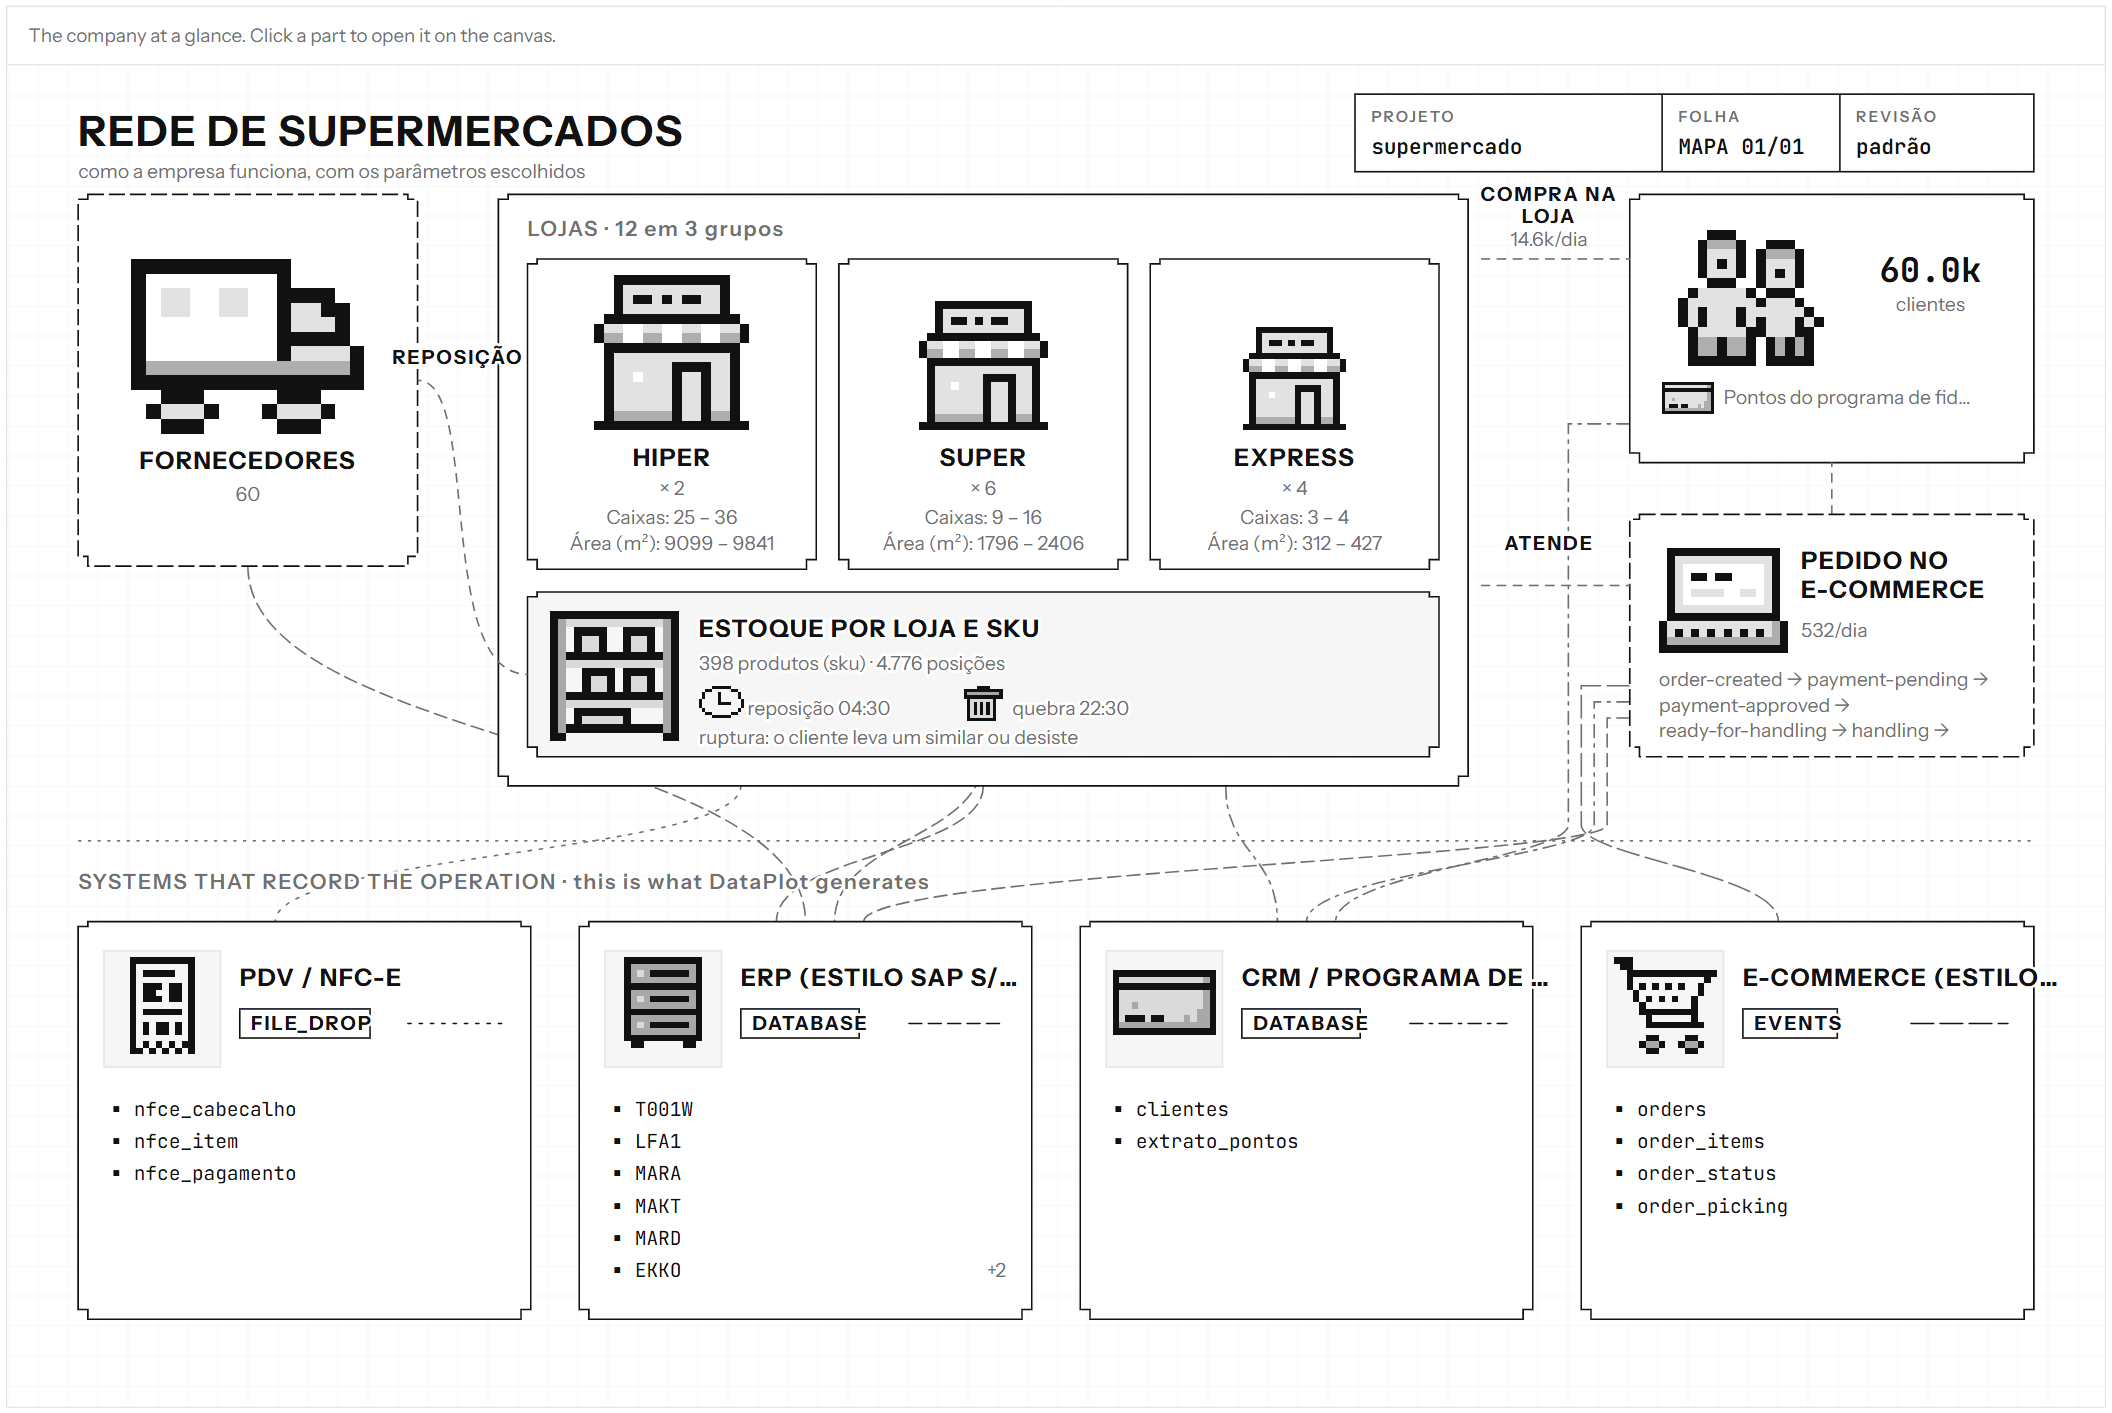
Map of the supermarket chain in DataPlot: suppliers, stores, stock, customers and e-commerce at the top; the point-of-sale, ERP, CRM and e-commerce systems below, with their tables
Each company has a map: how the business works and which systems record it.
Estimate of a run: rows and bytes per day, memory, CPU and the recommended sizes for Postgres, Kafka and files
The estimate tells you how much a run will write and how big each destination needs to be.

Getting started takes one command

All you need is Docker. The image holds DataPlot with every company and the full guide, in English and Portuguese.

1. Start DataPlot

$ docker run -p 8080:8080 -v dataplot-data:/data gartito/dataplot

Open http://localhost:8080, pick a company and set up a run. The dataplot-data volume keeps saved runs and the files they write.

2. Or use the command line

$ docker run --rm gartito/dataplot scenario list

The same image runs the CLI: scenario run, scenario estimate, scenario manual. Use it to script your labs.

What's next

DataPlot stays free to download. These are the next things we are weighing; leaving your e-mail is how we know they are worth building.

Challenges coming soon

Ready-made exercises on the simulated companies. Join the waitlist and we will e-mail you once, when the first ones are ready. No newsletter.

Commercial licence

Using DataPlot at a company, in a course or for demos? Ask about a commercial licence.

Questions

Is it free?

Yes. The image and every company in it are free to download and use. Using it at a company, in a course or for demos? Ask about a commercial licence.

Does it send data anywhere?

No. The image has no telemetry and calls no server. Data goes only to the destinations you set up.

Do I need Postgres and Kafka?

No. Files on disk are enough to start. When you want, point it at your own services, local or in the cloud.

Is the data always the same?

With the same seed, yes: the same company writes exactly the same data, so you can redo a lab and compare results.

Which countries?

The United States, the United Kingdom, Germany, France, Italy, Spain, India and Brazil. A run can mix them: one company with stores or listeners in several countries, each in its own currency, time zone and calendar.

Does DataPlot grade my pipeline?

No. It controls the company and the data, never the method: how you build the pipeline is up to you.

Is it open source?

No. DataPlot ships only as a Docker image, for amd64 and arm64.

Does this website track me?

No cookies and no banner: cookieless visit counts and CloudFront's access logs. The privacy note lists what is collected.
Get in touch

Found a bug, have a question or built something with DataPlot? Tell us here. That decides the next companies.

We reply to the e-mail you give. The message and the images reach only us (privacy).

Subject
Images up to 3, optional